Competency Area 6: Watershed hydrology AEM
PO 58. Understand a stream hydrograph and its relation to pollution. Understand the relation between a pollutograph and a hydrograph.
|
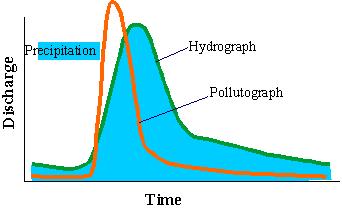
A stream hydrograph is a graphical or tabular representation of the stream flow rate (cubic feet per second) with respect to time. A pollutograph would be a similar graphical or tabular representation of the concentration of pollutants or contaminants with respect to time. When the stream flow rate and pollutant concentrations are graphed or tabulated together with respect to the same time, one can observe how the stream flow and pollutant concentrations vary with respect to each other. By multiplying the stream flow rate times the pollutant concentration, the total load (i.e., pounds) of pollutant delivery is determined, and can be accumulated for some stream flow time period.
|
Courtesy of Dr. Harold Van Es image source: http://www.css.cornell.edu/faculty/ |
|
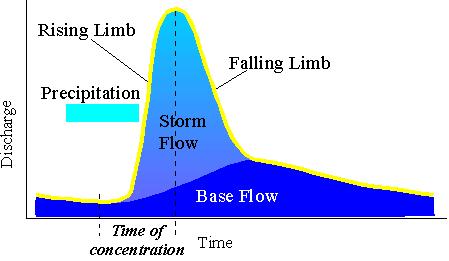
Some characteristic features of a stream hydrograph are its rising limb, peak flow, and falling limb or recession curve. The rising limb portion is where the stream flow rate is increasing. The peak flow represents the maximum flow rate that occurs, and the falling limb or recession curve is the portion showing how the stream flow rate decreases. When the rise and subsequent fall of the stream flow rate happens quickly as a result of a rain event, the stream is referred to as flashy. In contrast, if this rise and fall takes a long time, the stream is sluggish. At the outlet of a small, steep gradient watershed, stream hydrographs tend to be flashy in response to thunderstorms because the runoff (storm flow) concentrates and then dissipates quickly. A watershed with extensive impervious surface or compacted soils will also have a flashy response, compared to a similar watershed that is forested. Some pollutant concentrations increase quickly with increasing stream flow, and the concentration may peak before the flow rate peak. Suspended sediments, phosphorus, fecal coliforms, pesticides and other typically sediment bound type pollutants (with high soil-water adsorption partitioning coefficients) would be examples of this type of response. This is often referred to as the first-flush of pollutant delivery. The concentration of other dissolved pollutants such as nitrate-nitrogen and chloride salts are less affected with increases in stream flow rate, and may actually decline somewhat during the stream flow rate peak, but then gradually increase during the recession of the flow. The delayed increase in concentration of dissolved pollutants is often a result of the base flow (flushed groundwater) contributions. |
image source: http://www.css.cornell.edu/faculty/ |
Quick Links
- Competency Area 1: Basic soil properties
- Competency Area 2: Soil hydrology AEM
- Competency Area 3: Drainage and irrigation AEM
- Competency Area 4: Soil health and compaction
- Competency Area 5: Soil conservation AEM
- Competency Area 6: Watershed hydrology AEM
- Competency Area 7: Non-point source pollution AEM
- Competency Area 8: Concentrated source pollution AEM
- Competency Area 9: Conservation planning AEM