Nutrient Management
Competency Area 3: Soil Testing and Plant Tissue Analysis
|
Soil testing is the basis for P, K, Mg, B, and Zn recommendations. Soil testing is used to determine nutrients already present in the soil. This indicates what may be lacking, and therefore which should be supplemented through fertilizer or manure application. Without locally applicable crop response data, a soil test is useless. It is important to know how a specific crop in the area will respond to supplementation. This reduces the risk of over- or under-applying nutrients. Repeated soil tests, over time, generate historical data and trends that can be combined with yield data, allowing prediction and more accurate diagnoses in future years. |
|
Different laboratories and companies report nutrient content in different units. The most common are ppm (parts per million) and lbs/acre. In addition, the form of nutrients (particularly P and K) can either be presented in the elemental form (i.e., P or K) or the oxide form (K2O or P2O5). Conversion between the different forms and units is important, as one cannot directly compare ppm of P to lbs P2O5/acre.
|
|
Anything that induces variability in the field will increase the amount of sub-samples that must be taken. This reduces the likelihood that the results of a given composite sample will be skewed by a sub-sample taken from a non-representative area of the field. The method of previous fertilizer application can change the nutrient profile of a field. Banding fertilizer and manure spreading are known to increase spatial variability within a field. As not all areas receive the same amount of fertilizer or manure, the nutrient availability differs throughout the field. The more variability there is, the more sub-samples should be taken. If the location of the fertilizer bands is known, samples should NOT be taken directly from the band. Tillage systems impact the distribution of nutrients over a field and over depth. Deep tillage, zone tillage, etc. will differ in thoroughness of mixing and thus in nutrient variability. The more tillage there is, the less variable the nutrient distribution, and the minimum recommended sub-sampling guidelines can be followed. Nutrient stratification, or irregularities in where nutrients are located throughout the soil profile, is influenced primarily by tillage. In no-till situations, nutrient stratification is usually greater than for conventionally tilled fields. Consistent sampling to the recommended depth is critical. For soil pH in no-till systems, two soil samples will be needed: 0-1 inch (for seeding), and 1-6 inches. If the surface sample pH is lower than 6, a limestone application should be made, even if the deeper sample does not call for liming. |
|
Within-field soil and crop variability encompasses other uncontrollable differences within a field. Thus, there are a minimum recommended number of sub-samples to be taken, and recommendations on the areas those samples should be taken from.
|
|
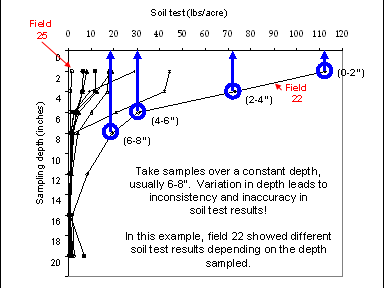
In addition to affecting how soil samples are taken, various aspects of management can affect the results obtained from soil tests. These should be taken into account and procedures should be observed to maximize the accuracy of samples. Nutrient content of the soil solution and soil matrix vary depending on the time of year. Temperature, moisture, pH, and aeration vary with the climate, and during or after the growing season, nutrient levels are affected by crop removal. To minimize variability and build the strongest historic records, take samples at the same time each year. Samples should be taken over a constant depth to minimize variability and build strong historic records. The soil sample depth depends on the tillage type used (usually 6-8" deep), as lime and fertilizer are mixed in the tillage layer. For determining lime requirements in a no-till system, take two subsamples: 0-1" and 0-6 or 8". |
|
Number of samples taken depends on the size of the field, field characteristics, and field management, as discussed in PO 16 and PO 20. One sample generally should not represent more than 10 acres, and should only represent one management unit, ideally a uniform soil-type area. Samples should be taken at least once in three years, or twice per rotation. Samples should be taken with clean equipment (probe or auger and plastic bucket), taken consistently (2-3 subsamples per acre on a uniform field), and selected to avoid misrepresentation (avoid fence rows, manure, stones, wood; sample between rows away from fertilizer; avoid sampling when wet). The type of extraction method varies with the laboratory and with which tests are being done. The laboratory you send to and the extraction type should remain the same. Many different methods exist, and some are interconvertible, but not completely accurate. Historical records cannot be developed with results from different labs. Remember – your soil testing results and the fertility recommendation you make based on the soil test can never be more accurate than the soil sample you take! |
|
Three main approaches have been developed to determining nutrient status and calculating needs. Sufficiency level recommendations are most commonly used by Land Grant Universities and their laboratories. The recommendations utilize the yield response method; i.e. fertilizer rate is based on expected crop response (i.e. increased yield), a function of soil nutrient levels. The agronomic soil test is an index that can be used, based on a large amount of local field studies, to determine:
Results from soil tests are categorized as being either "high," "medium," or "low" for a given nutrient. Crops in high-test soils are unlikely to demonstrate any yield response to additional fertilizer; crops in medium-test soils may or may not show a yield response; and crops in low-test soils are likely to respond to additional nutrients. Fertilizer recommendations are made appropriately. Overall, this method of recommendation leads to a slower increase in soil test values, and keeps the soil test values lower than result from other methods. This is primarily due to a decreased fertilizer usage than in the other approaches. |
|
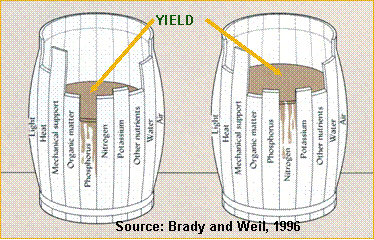
The limiting factor concept is utilized in the sufficiency level method of making nutrient recommendations. It states that crop yield increases will cease when a nutrient or factor "runs out;" i.e. it cannot promote further increases. When that factor is supplied, yield will increase until another factor becomes limiting. The first limiting factor is the component lacking first; the second and third limiting factors are those that only come into play after the first has been amended. In the below example, each plank of the barrel represents one of the essential components of plant growth. The fill of the barrel represents yield. At first, phosphorus is limiting; once there is not enough P to go around, yield cannot increase further. Once more P has been added, yield can increase until it hits the next-limiting nutrient (in this case, N). |
|
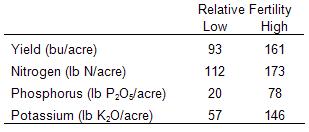
Soil buildup and maintenance recommendations aim to evaluate soil nutrient levels, alter these levels via fertilization and/or crop removal until they are at an optimal level, and then maintain that level. Fertilization is heavy and quick, increasing soil test values rapidly over a few years, and then the subsequent maintenance fertilizer applications are made to crop removal levels. The buildup part of the recommendation is determined by the expected crop response to the added nutrients. Fertilizer recommendations are made using an index, which predicts yield response ased on soil test levels and different application rates. The maintenance part of the recommendation is based on replacing the amount of nutrient expected to be removed by the crop. This should keep the soil test level from falling below optimum between soil tests. When the soil test reaches a level where crop removal will not reduce the soil test level to below optimum, no additional nutrients are added. The crop is allowed to draw the nutrient levels down into the optimum range. While this method is fairly simple, it ignores non-agronomic losses of nutrients (leaching, volatilization, etc) and requires knowledge of crop nutrient content. Below is an example of soil buildup and maintenance recommendations. Soils are classified as either fertile or not, which influences the amount of nutrients added. |
|
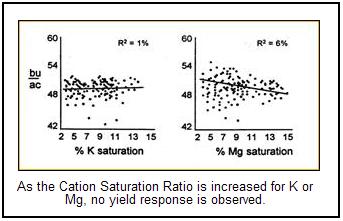
Cation saturation ratios are not commonly used as the basis for nutrient recommendations. The process assumes there is an ideal distribution of exchangeable cations (Ca, Mg and K) on the CEC. These nutrients then can be drawn off the CEC. When they are in balance, the soil solution ensures adequate nutrient availability to plants. The most commonly applied ratio is: 65% Ca, 10% Mg, 5% K, and 20% misc. However, past studies suggest no relationship between %K and %Mg saturation and yield. Especially for calcareous (high pH) soils, adjustments to particular ratios can be very expensive, and saturation estimates (particularly for K) are not reliable. Generally, if the soil pH and the soil test K and Mg levels are optimum, the balance of cations on the CEC will be acceptable for optimum crop production. Further adjustments to cation saturations on the CEC are unnecessary. Several studies suggest that despite increasing % saturation for K and Mg, crop yield shows no response.
|
|
|
An agronomic soil test is an INDEX of nutrient availability: something we can measure that is correlated with a likeliness of a crop response. An agronomic soil test is NOT a measure of the total amount of a nutrient in the soil.
An agronomic soil test is NOT a measure of the total amount of soil nutrient available to the crop.
The probability of crop response to added nutrients is estimated when soil tests are classified as high, medium, or low. These classifications are matched with recommended fertilizer rates. Other factors, such as irrigation, may influence the availability or loss of nutrients in a soil, and can further change the recommended fertilizer rate; tables or equations are used to arrive at the final rate. The estimate of nutrient sufficiency level affects the likelihood of a crop response. As nutrient sufficiency increases (i.e. a high test level), the probability for crop response to fertilizer decreases, and the soil test recommendation becomes less reliable. The units used in soil test reports and fertilizer recommendations may vary, as already mentioned. Conversion equations can be found in PO 15. High variation within the field being tested will decrease the accuracy and reliability of the soil test recommendation. PO 16, 17, and 20 emphasize the importance of proper soil sampling techniques to reduce variability and poor representation. |
|
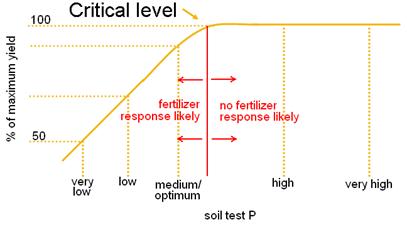
There is inherent environmental risk when applying nutrients. Runoff from fields can contaminate water supply and pollute the nearby areas. Soil test recommendations may consider this risk, as well as plant response, when developing fertilizer rates. If the risk is high, the recommended rates may be lower than in other fields where there is low risk. Studies have shown that no yield response to an applied nutrient will be observed if the soil levels of that nutrient are above a certain critical soil test level. This is based on long-term calibration of soil tests, combined with local field yield response data. Thus, fertility recommendations are state-specific and sometimes even region-specific. Keep in mind; soil testing for fertility management requires locally-applicable crop response studies that link soil test levels to probability of a crop response and actual nutrient needs. |
|
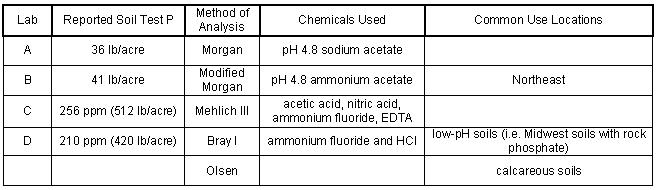
As a first requirement, a good soil testing laboratory needs to have a good quality control system in place. However, even high-quality laboratories can give different results if you were to split samples and send subsamples to different laboratories. This is because soil testing laboratories can differ in:
The table below shows the soil test P results made by different laboratories on identical soil samples, and compares the different soil test methods. Again, be sure to always use the same laboratory to avoid improperly fertilizing your soil! |
|
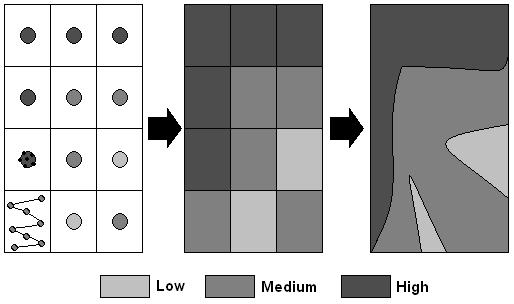
Random sampling is appropriate for fairly uniform fields 10 acres or less in size. 2-3 samples per acre should be taken in a random pattern that covers the field, which reduces the risk of sampling multiple soil types within a field. Grid-based sampling is useful when there is large within-field variability, if that variability is within the responsive range for nutrients and pH, and if the farmer has the ability to manage based on this variability. The field is divided into small blocks (grid cells of about 1-4 acres each) and a separate sample (consisting of 6-10 sub-samples) is taken from each of these grid cells. Sub-samples may be taken from a small area at the center of the grid cell, or taken randomly from throughout the grid cell. Sample results are compiled either directly into a map showing the different soil test levels and recommendations for each grid cell, or the test results may be statistically smoothed to create a map. Soil type-based sampling is similar to grid-based sampling, in that a field is divided based on soil type, and samples are taken randomly from within those different areas. |
|
To obtain an accurate soil test:
To generate the best soil record database:
To take an accurate soil sample:
|
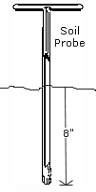
For proper soil sampling, the soil probe should be inserted into the soil perpendicular to the ground, and to the appropriate depth. (image source) |
|
Guidelines for Sampling
|
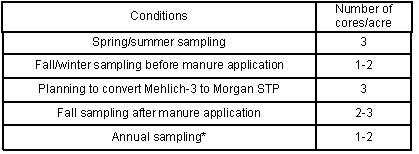
Mehlich-3 to Morgan conversion may provide unsatisfactory results across years. When using a conversion, one sample per acre annually is only a substitute if the accuracy of the conversion equation has been checked (i.e. sample is split, sent in for both Morgan and Mehlich-3 analysis, and both the true Morgan and the estimated Morgan compare well).
|
Strategic soil sampling across a field allows the user to generate a map of the field based on soil types and characteristics. When possible, these characteristics should be incorporated into the management of the area. (Image adapted from the NRCCA training manual, PO 20.)
|
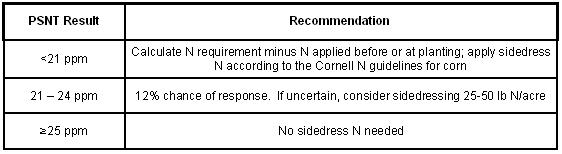
Most universities in the Northeast do not use a soil nitrogen test, because nitrate is very mobile and soil nitrate tests do not correlate well with actual N supply from the soil. Rather, nitrogen requirements are based on yield potential, N supply from the soil, and other organic N sources (composts, animal and green manures) and N uptake efficiency. The exception to this is the Pre Sidedress Nitrogen Test (PSNT). The PSNT is an in-season nitrate test for corn that predicts organic N to be mineralized. It is designed to:
Vermont determines application rates based on PSNT results. Other states (e.g. NY) use the PSNT as an indicator only. By avoiding the unnecessary application of N, producers save money and reduce the risk of nitrate leaching. Testing is done at sidedressing time, just before the period of major N demand. It is most useful for fields with a history of manure and/or sod incorporation. However, it cannot be used if broadcast or pre-plant N has been applied (over 40 lb N/acre), as "leftover" nitrate will be detected and will overestimate soil supply. |
|
Several factors influence the results of the PSNT.
|
|
For fields with <21 ppm:
|
|
Analyzing plant tissue can indicate the success of a soil fertility program and uncover potential problems. Plant tissue analysis complements soil testing by measuring the nutrients actually taken up by the plant. In addition, secondary nutrients and micronutrients that currently are not routinely measured in soils can be measured reliably in plants. It should be noted, however, that plant nutrient content represents the effects of not only soil nutrient status but also all the factors controlling plant growth. Therefore, a single year's information may not be useful for planning a soil fertility management program. But as results are accumulated over a period of years, the information will become more valuable. Sampling plant tissues allows for diagnosis of nutrient problems, whether deficiency, sufficiency, excess, or toxicity. The information may be used to change aspects of the current nutrient management plan, or to alter future plans. Tissue analysis allows for nutrient program monitoring by following the concentration and amount of a nutrient in a crop during the growing season. Deficiencies or excesses may change the current plan, or may influence nutrient amendments for future years. The nutrient concentration in a plant varies with the plant's age and the part of the plant sampled. If plant analyses are to be meaningful, the appropriate plant part must be collected for the age of the plant, and a number of plants must be included to obtain a representative sample. Specific directions on plant sampling generally are available with each sampling kit from the plant analysis laboratory. Plant tissue analyses also are used to fine-tune the current season's nutrient management. Recommendations based on plant tissues usually involve application of specific fertilizers at key times during the cropping season. |
|
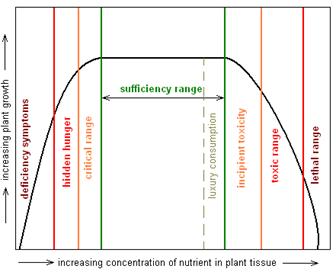
Critical value or range indicates the soil or tissue content below which the plant most likely is deficient in that specific nutrient and production could be enhanced by addition of the nutrient. Below that critical value, the nutrient levels are below optimum. The sufficiency range is the nutrient level at which the plant has enough nutrients to function and develop properly, but not so much that it is poisoned. This is reported as "medium" or "high" on soil tests. Optimum, below optimum, and above optimum soil nutrient levels are terms used to describe whether plants have sufficient nutrients. If soil test levels are below the critical agronomic value, the test will come back as below optimum; if soil test levels are above the critical agronomic value, the test will come back as above optimum. Luxury consumption occurs when soil nutrient levels are above optimum and plants take up more of a nutrient than needed for functioning and production. Potassium (K) is commonly taken up in excess. The toxicity level is the nutrient level at which there is so much of a nutrient that it can harm the plants. This value will be reported as either a "high" or "very high" level on a soil test. |
|
|
|
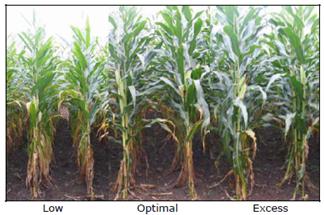
Corn plants exhibiting symptoms of low (left), adequate (middl e), and excessive (right) nitrogen. (image from http://nmsp.css.cornell.edu/publications/factsheets/factsheet31.pdf)
|
|
Multiple factors influence the analysis of plant tissues and the recommendations made from those analyses. Crop species and growth stage affect the age and area of plant to be sampled, as well as the critical value, sufficiency range, and toxic value for the nutrients being examined. The plant parts sampled should be healthy to obtain an accurate, meaningful result. The plant part should not be covered in soil or dust, mechanically injured, damaged by insects, or diseased. Furthermore, attention should be paid to the particular test(s) being done, as the relationship between plant analysis and response varies with the parts sampled. Crop stress level can impact nutrient concentrations. Sampling should be done on plants that are not under moisture or temperature stress, as they can develop unusual concentrations of minerals, which can be misleading. Nutrient concentrations vary throughout the day, so the timing of sampling is important. Unless specified otherwise by a particular test instruction, early morning sampling is preferred, to avoid aberrations due to moisture and temperature stress that may result at other times of the day. Proper sample handling assists in providing accurate, meaningful results. Samples should be cleaned to remove surface contamination. Washing should be quick to avoid the leaching of nutrients like P and Ca. Kits are usually available, which include instructions that tell you what portion of the plant to sample, how many plants to sample, the age of the plants, etc. They may also include tips on how to dry, store, and ship the samples. |
|
When utilizing plant tissue analysis, it may be helpful to take samples from the problem area and a nearby "normal" area for comparison. Use all available information to interpret the plant analysis for diagnosing a nutrient deficiency. Look carefully at the symptoms on the plants, note any patterns in the field, and consider the timing of the problem's appearance. Keep in mind that not all nutrient deficiencies in plants are the result of nutrient deficiencies in the soil. Soil testing and plant analysis can confirm each other, but they also can indicate when the cause of the problem is something other than a nutrient deficiency in the soil. If the soil test level is adequate but the plants are deficient, some other factor is limiting the plant's ability to take up available nutrients. Some factors to consider include possible interactions with other cultural practices such as tillage or pesticide use; pest injury such as rootworm feeding; differences in varieties or hybrids; or soil physical conditions such as compaction.
Stress of any type can produce or enhance plant symptoms. For instance, the purple coloring of corn in spring is brought on by cold stress and/or too-deep cultivation. Similarly, pruning plant roots can result in K deficiency, and Zn deficiency is often the result of poor root growth. |
|
Practice Questions

 h
h